
Search All Site Content
Total Index: 6320 publications.
Subscribe to our Mailing List!
Sign up for our mailing list to keep up to date on all the latest developments.
The Peninsula
Has the KORUS FTA Cost the United States 100,000 Jobs?: Part I – A Look at Trade in Goods
This is the first part of a two part series looking at the impact of the KORUS FTA on jobs in the United States. Part II can be found here.
By Troy Stangarone
At a rally in Henderson, NV and in his speech before the Detroit Economic Club, Republican Presidential Nominee Donald Trump has suggested that the free trade agreement between the United States and South Korea (KORUS FTA) has cost the United States nearly 100,000 jobs. As evidence for his claim, he cites a blog by the Economic Policy Institute (EPI) that states that “Far from supporting jobs, growing goods trade deficits with Korea have eliminated more than 95,000 jobs between 2011 and 2015.” While Trump rounds the Economic Policy Institute’s (EPI) estimate up, in essence he is faithful to EPI’s claim. However, is EPI’s claim accurate?
To determine how the KORUS FTA has impacted jobs in the United States, EPI uses a multiplier based on U.S. government estimates of how many jobs the KORUS FTA would support from an increase in goods exports alone. This multiplier is derived from a comment by President Barack Obama in Detroit that the KORUS FTA would support 70,000 U.S. jobs and a White House fact sheet noting that U.S. merchandise exports to South Korea were expected to grow by $10-$11 billion.
The multiplier itself is based on work done by the Department of Commerce to determine how many jobs each $1 billion of U.S. exports supports. While the White House only focused on exports, EPI argues that to determine the full impact on jobs imports need to be considered as well. It then uses the jobs multiplier in combination with the change in the U.S. trade balance with South Korea (new export growth minus new import growth) to determine the number of jobs lost and gained – something that the Commerce figure is not designed to do. EPI measures the shift in jobs on the export and import side equally, making the shift the in deficit the relevant number for their metric.
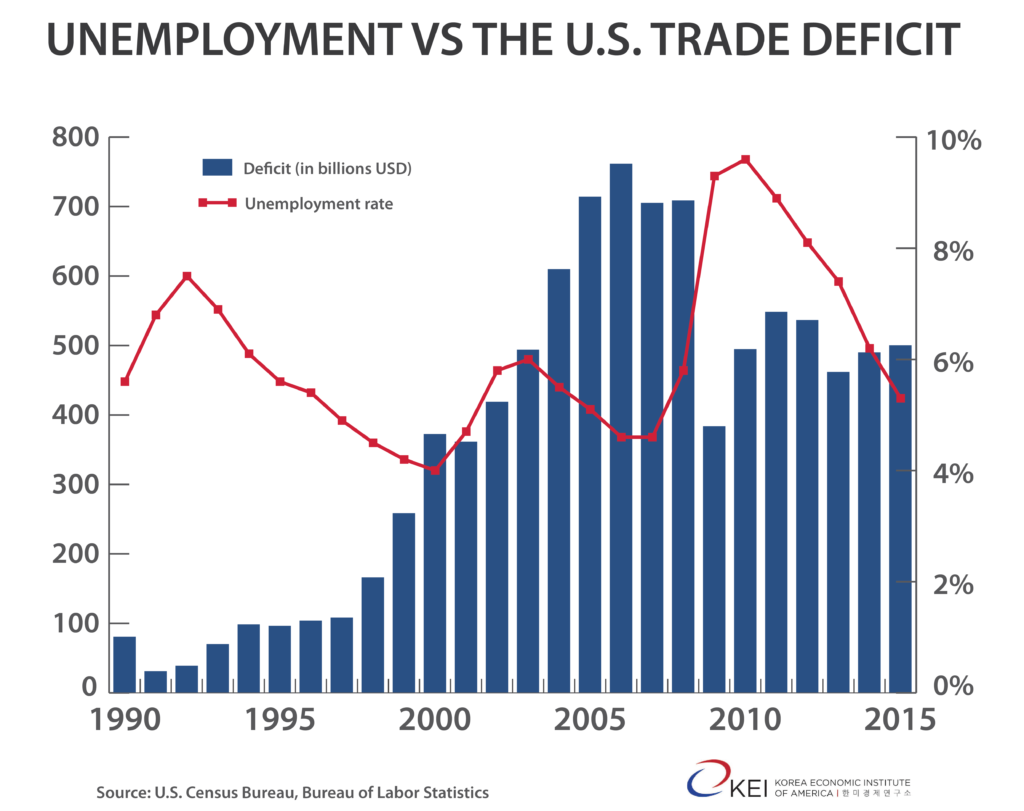
However, as others have demonstrated the trade deficit does not directly correlate with U.S. job losses. In general, U.S. unemployment has decreased when the trade deficit has increased. In 2006, the United States recorded its highest trade deficit ever, but U.S. unemployment was below 5 percent and lower than in 1992 when the trade deficit was $723 billion lower.

The Washington Post Fact Checker has also questioned the results of a similar study of the impact of the KORUS FTA on U.S. jobs, questioning both the study and the initial estimate by the administration. EPI offered its own critique of the Washington Post Fact Checker, noting that “By ignoring imports, Kessler completely ignores one of the most important factors in the effects of trade on employment.” A critique that we will return to of estimates such as EPI’s in Part II of this piece.
There are other critiques one can make in regards to whether imports and exports should have the same weight in determining jobs lost or gained, or why the expected results of the KORUS FTA have not come to pass. With one exception those are discussions for another time and the focus of this post is on whether the EPI estimates accurately reflect the potential shift in U.S. jobs from the KORUS FTA based on their own methodology. The exception is to note that the figures on the expected growth in U.S. exports to South Korea cited by both the White House and EPI are based on a report by the U.S. International Trade Commission (ITC) which bases those numbers on the agreement being fully implemented. The agreement is still in the process of being implemented. Further, the exact expectation for export growth to South Korea was $9.7-$10.9 billion rather than the rounded $10-$11 billion and the ITC itself indicated in its report the that impact on U.S. jobs would be “negligible.”
That being said, as with sports, there is significant interest among those who are anti- or pro-trade in the score both early in the game as well as in the end, so any estimates should be also taken with ITC’s caveat in mind.
A Deeper Look at EPI’s Job Estimates since 2012
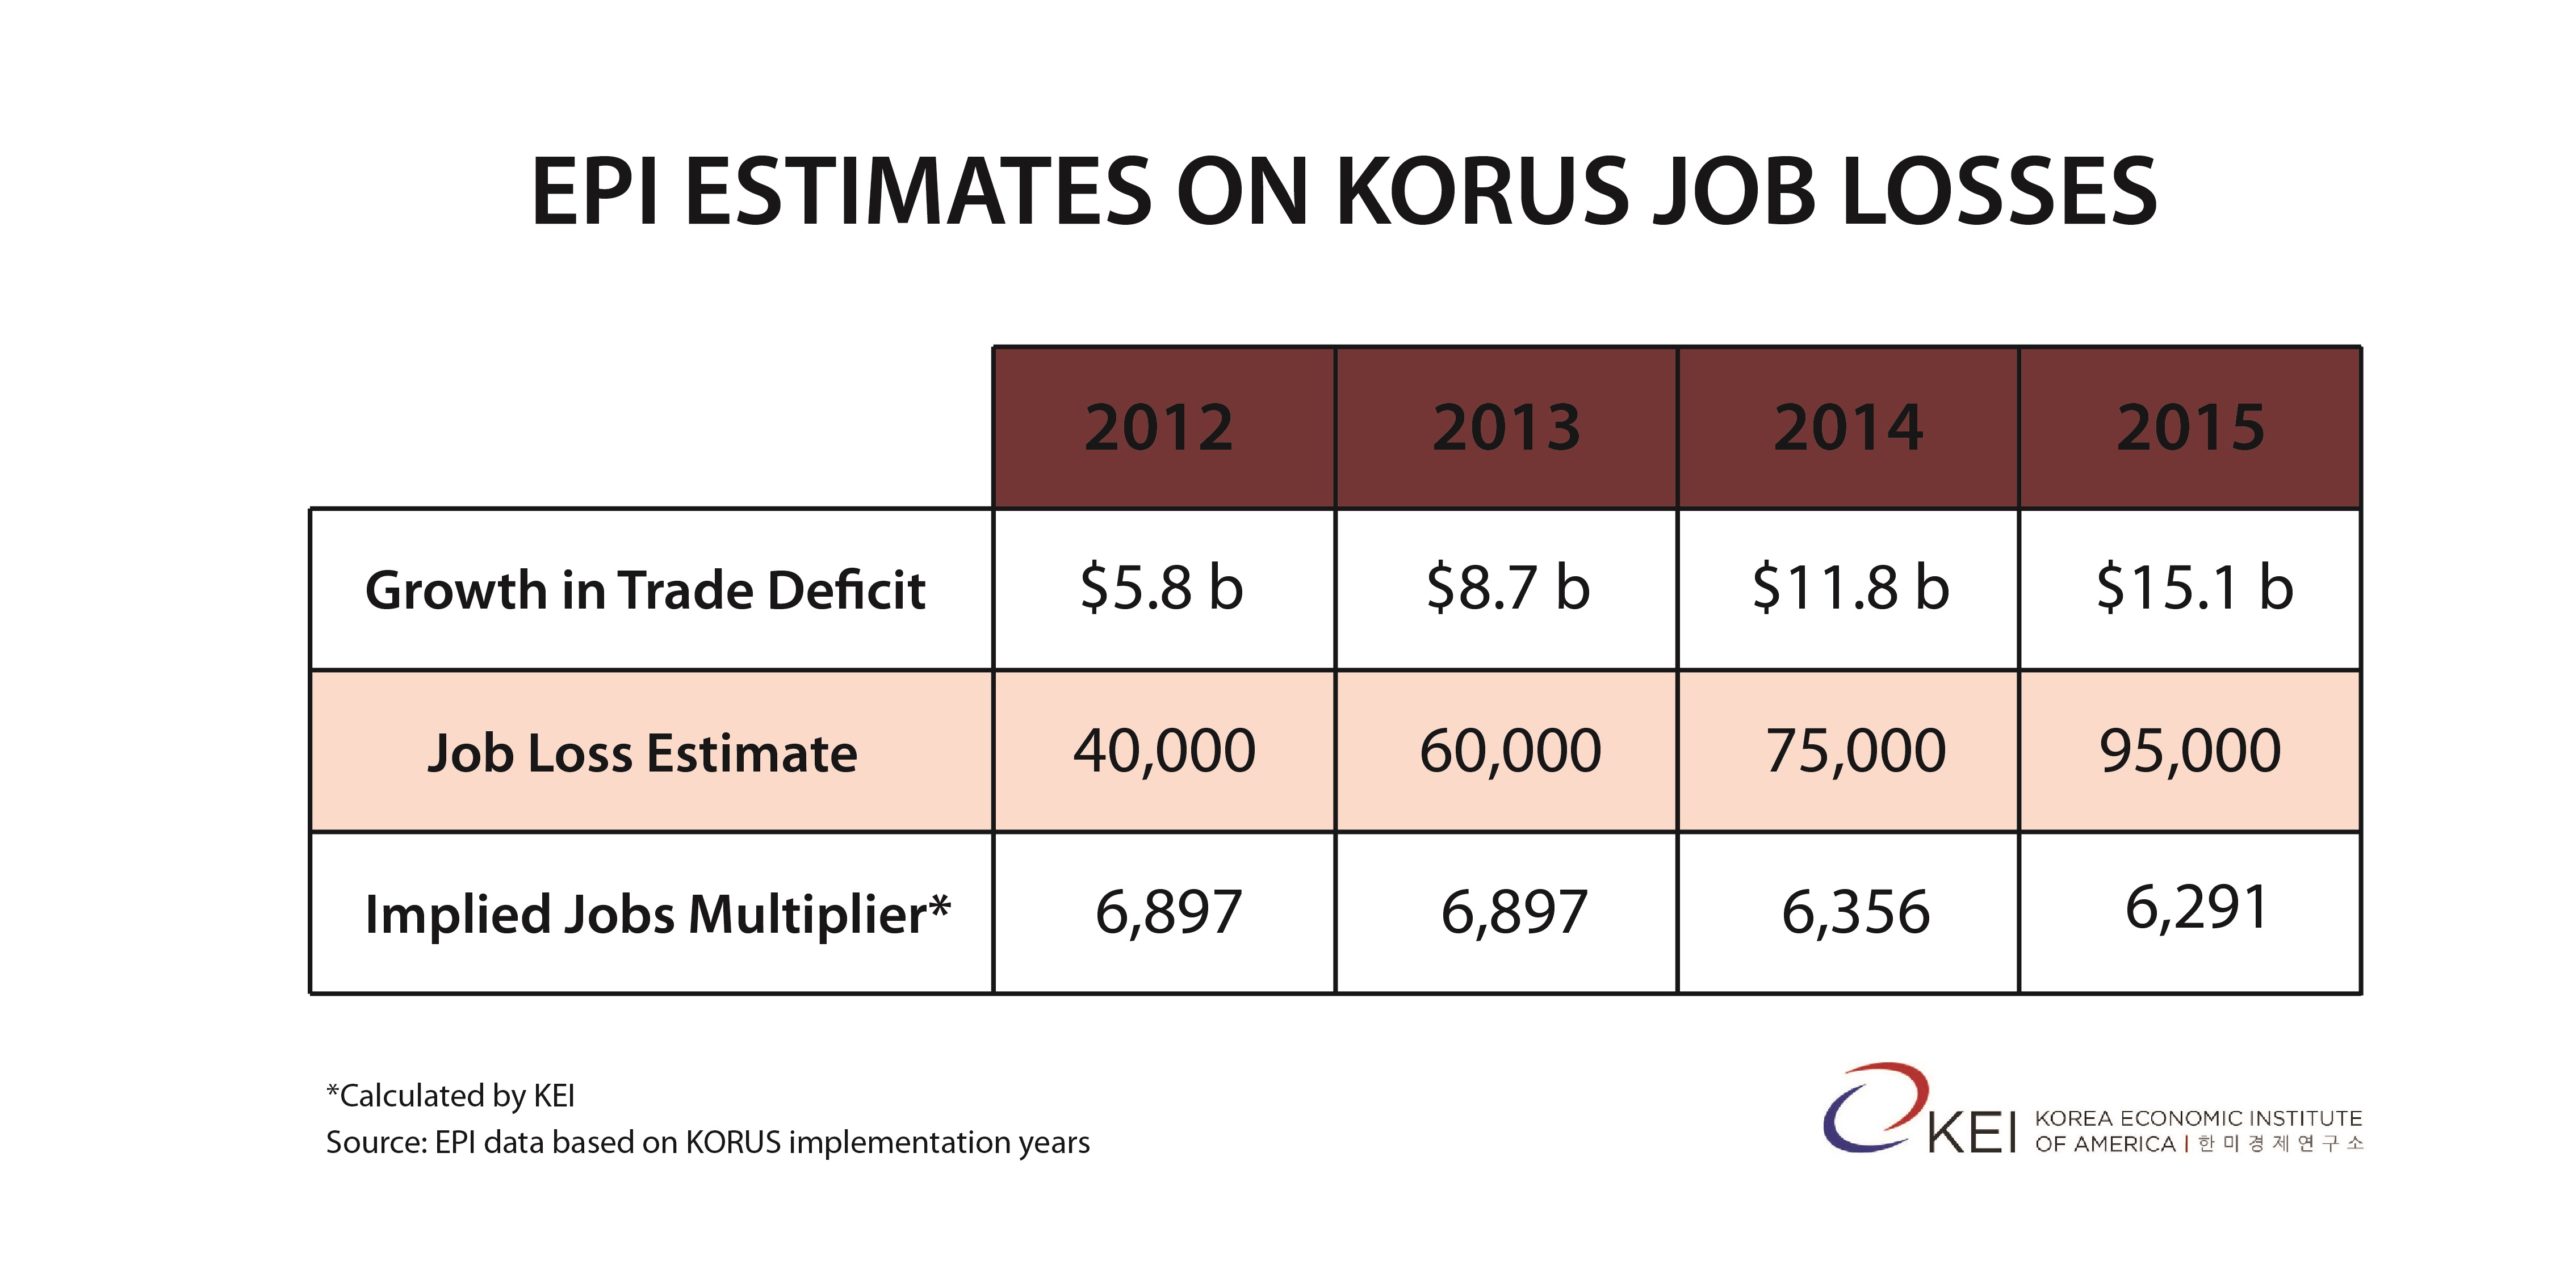
As EPI notes in annual pieces, the U.S. merchandise trade deficit with South Korea has increased since the KORUS FTA has come into force. In 2013, after the agreement had been in place for a year, EPI noted that the United States trade deficit with South Korea had grown by $5.8 billion (based on the date of implementation rather than calendar years) and calculated that this had cost the United States more than 40,000 jobs. The figures for each subsequent year in regards to the increase in the trade deficit since 2011 and projected jobs lost are in the table below.
The first question to answer is what is the multiplier that the White House used to come up with the 70,000 jobs figure? According to the Washington Post Fact Checker, the metric was $150,000 in exports supporting one job, then taking the mid-point of the estimated $10-$11 billion increase in exports. Dividing the expected increase in exports by the expected number of jobs supported we can find the number of jobs expected to be supported by $1 billion in exports. To expand the estimate to a range, if we assume that multiplier is based on the high end estimate of export growth, and hence the lowest possible dollar to job ratio, the multiplier would be 6364 jobs (rounded to the nearest job) per billion dollars of U.S. exports. If we choose the low end, $10 billion (using the generic range rather than the exact ITC estimate), we would get 7,000 jobs per billion dollars of exports. If you split the difference, you would get 6667 jobs per billion, also the multiplier suggested by the Washington Post.
As we can see, from the table above, EPI’s estimates and implied jobs multiplier all fall within this range except for the last which is slightly below the low end. Some of the fluctuation in EPI’s implied jobs multiplier is likely a result of EPI providing rounded estimates on jobs such as in the most recent report which claims that the U.S. has lost more than 95,000 jobs.
How Revised Data Begins to Change the Picture
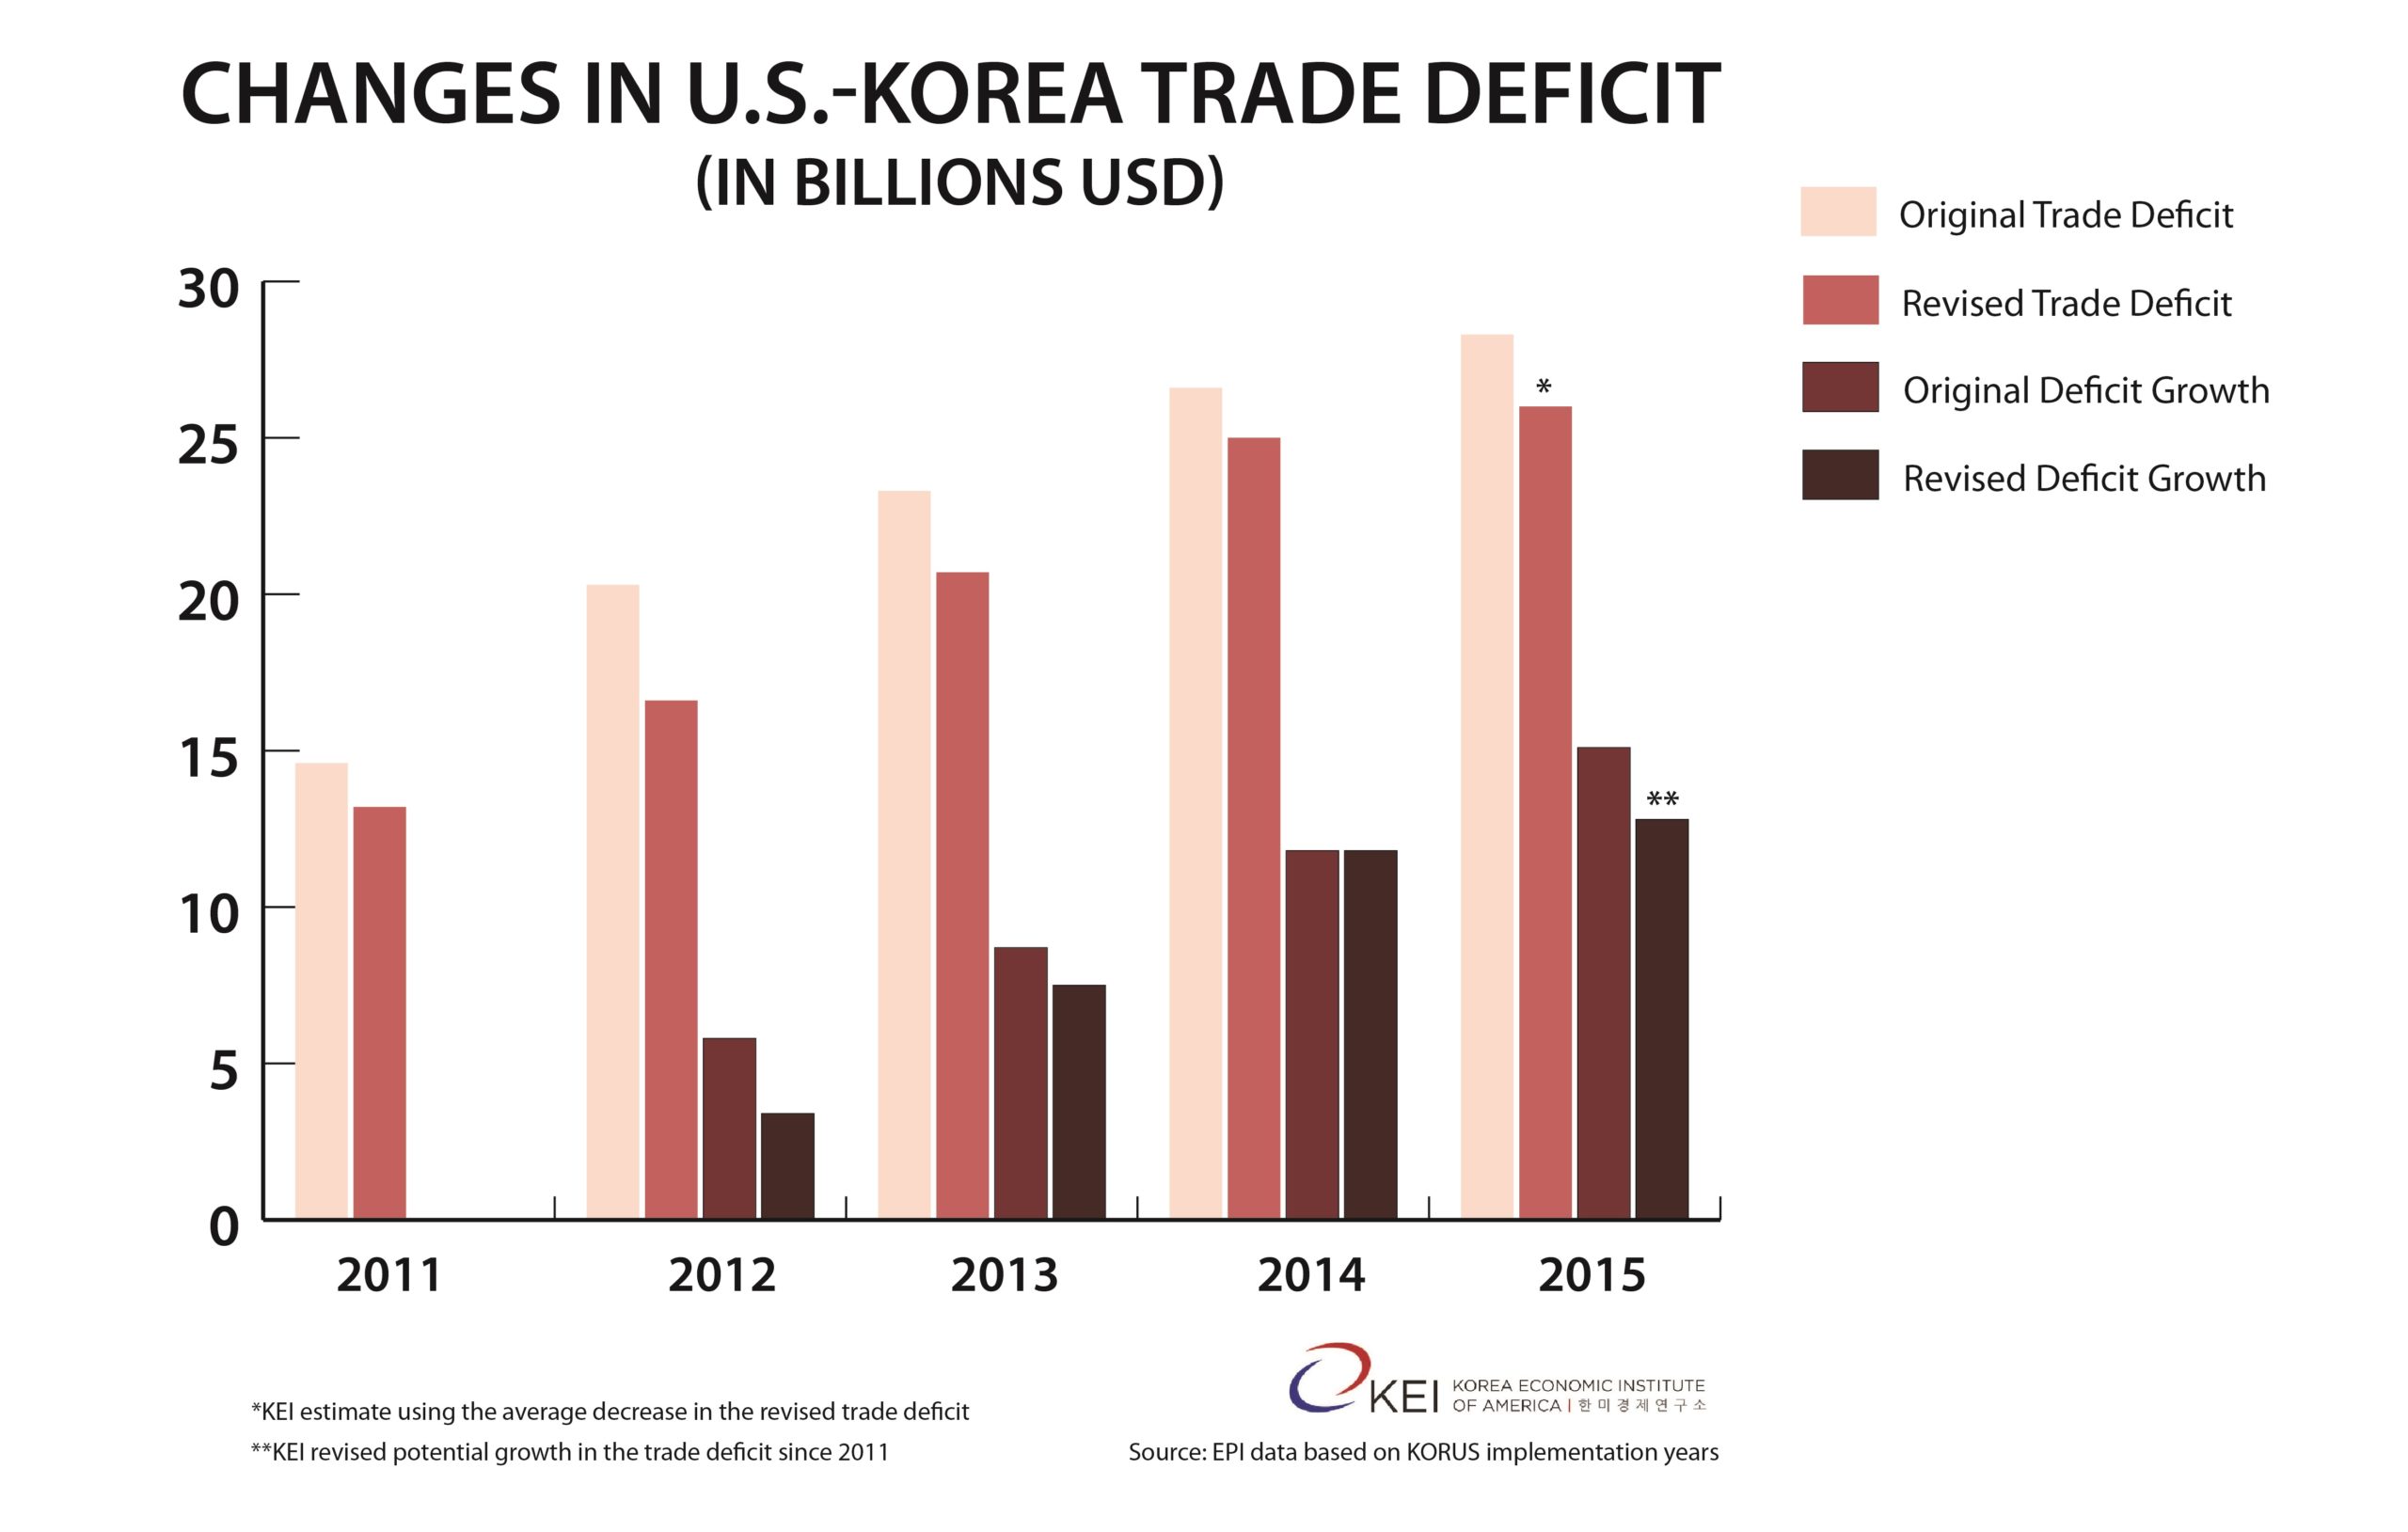
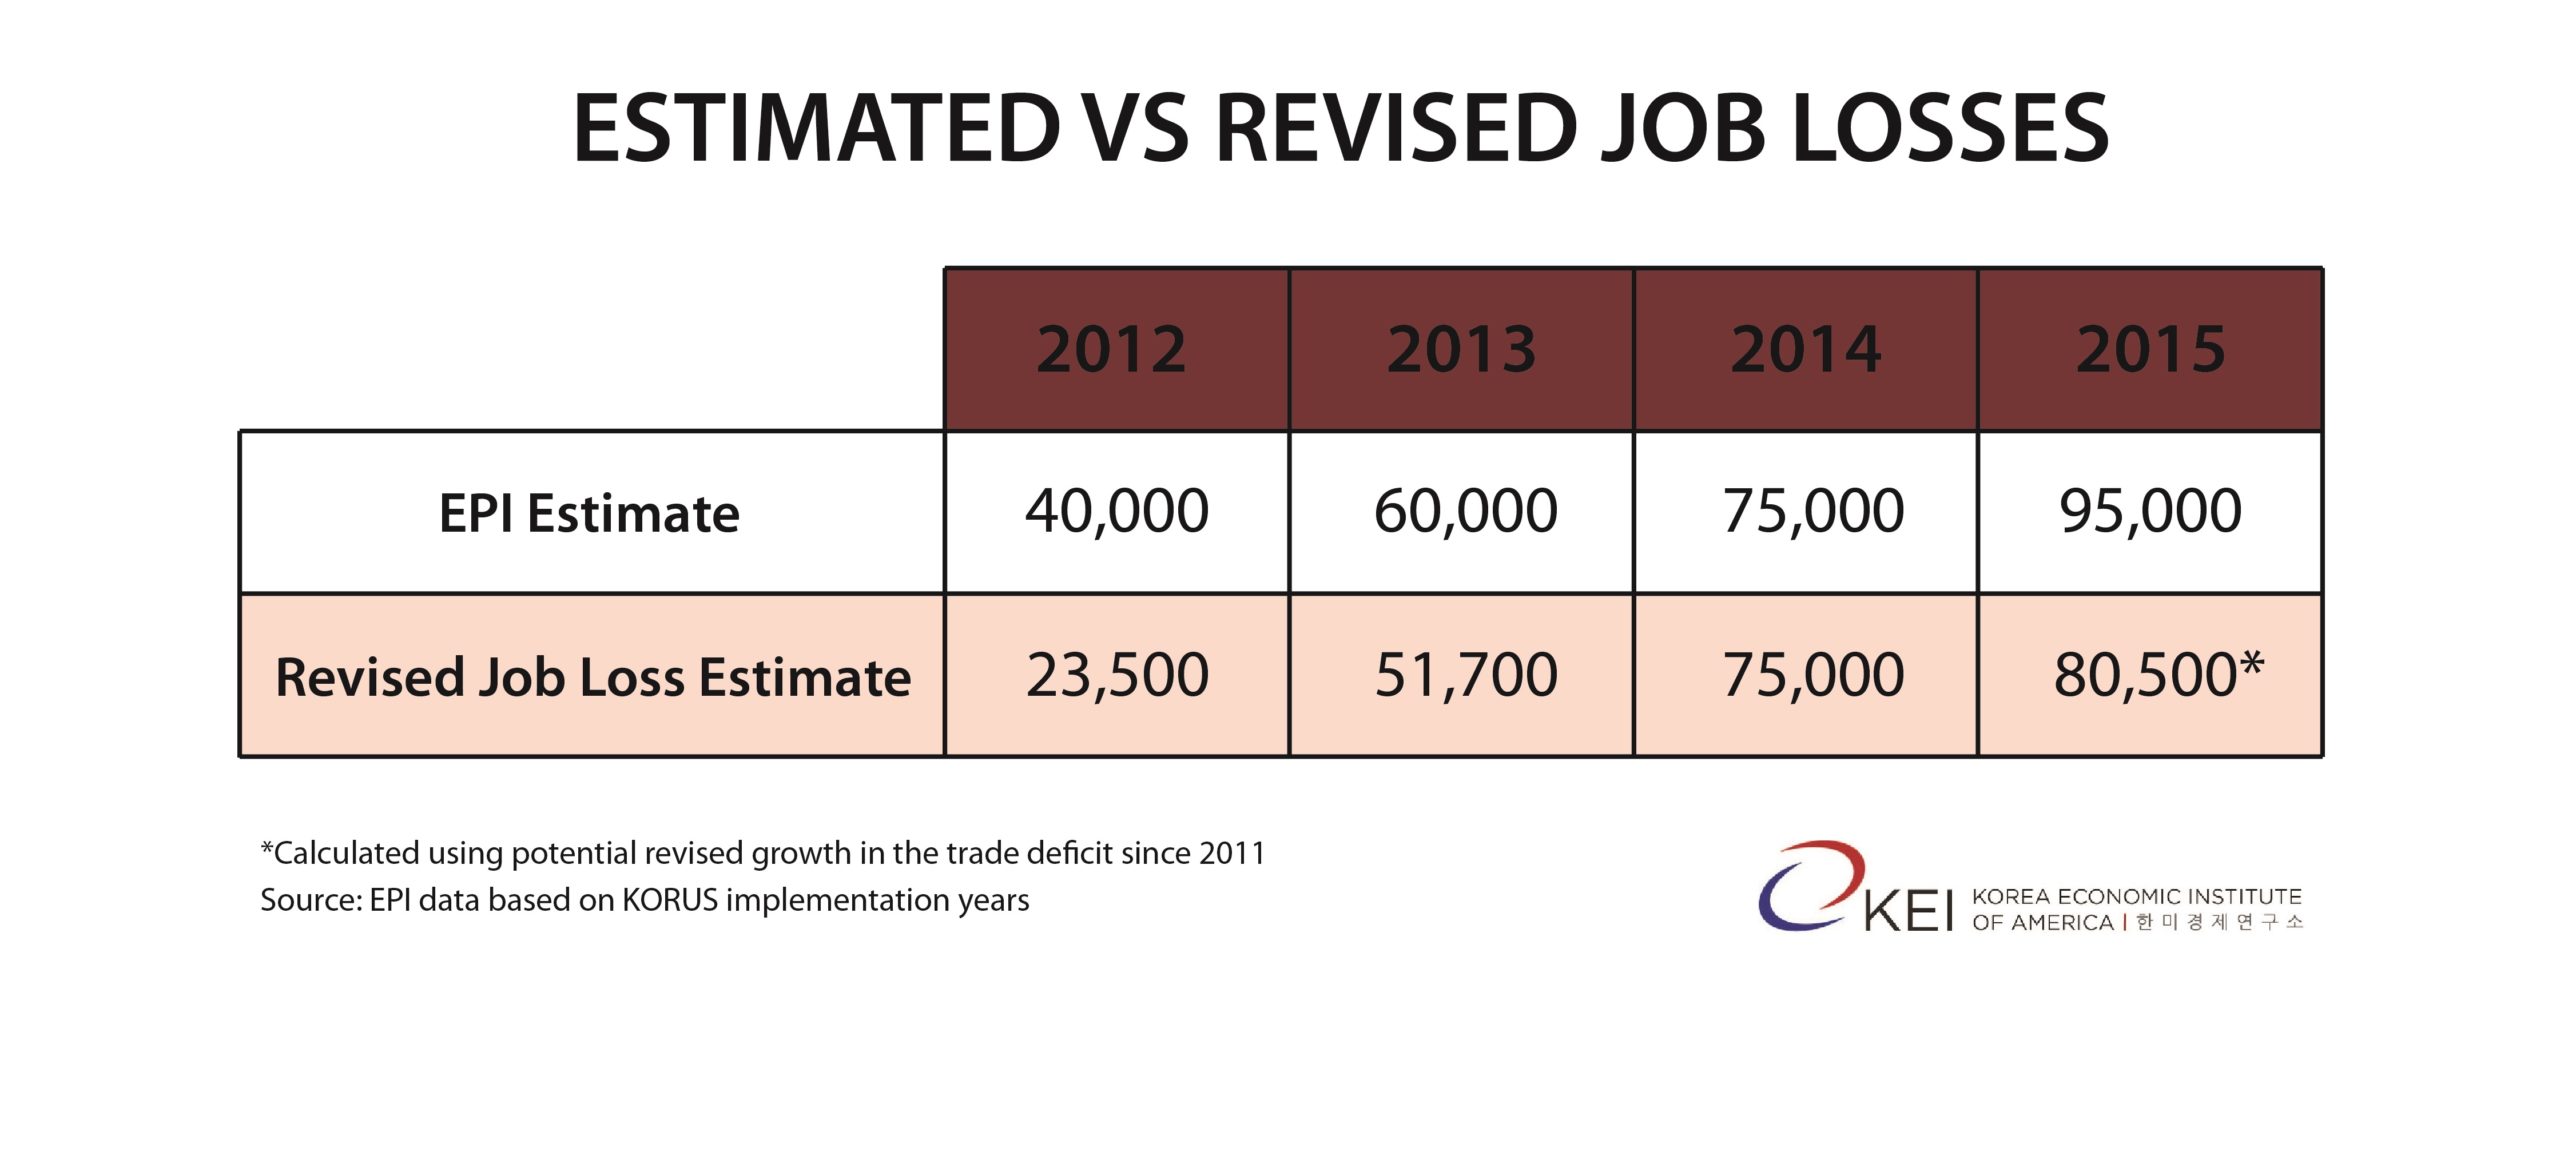
When looking at these numbers, there are two issues to consider. The first is that official trade data as initially released is preliminary and revisions often take place at later dates. For example, as can be seen in the EPI post for this year in comparison with earlier posts, there has been a general trend of revised trade data lowering the U.S. trade deficit with Korea. As a result, EPI’s estimates should be considered preliminary as this trend also lowered the original reported growth in the U.S. trade deficit with Korea. Using the same methodology as EPI, the bar graph and table below show the revised deficit numbers and the revised job numbers for each year based on the EPI methodology. The revised job numbers are calculated using the implied EPI jobs multiplier found in the previous table. Since there is no for revised data on 2015 at the moment, we have used the averaged revised decline in the U.S. deficit. This, of course, should only be taken as a preliminary estimate of how the picture might look in the future.
The second issue is that while the Obama administration provided an estimate of expected jobs supported, much like trade figures the number of jobs supported by exports, is revised as well. As each billion dollars of U.S. goods exports supports a fewer number of jobs, any estimate made by the Obama administration today would likely be lower than the 70,000 jobs the administration projected. The revised multiplier supplied by the Department of Commerce for the years 2012-2014 ranges from 5,175 in 2012 to a low of 4,969 per $1 billion in exports in 2014. While there is a decline in EPI’s implied multiplier, it seems to be significantly above what Commerce currently estimates U.S. exports support in terms of jobs.
As detailed above, the EPI method of evaluating the impact of the KORUS FTA on jobs in the United States comes with drawbacks and does not seem to reflect trackable results in the U.S. economy. While EPI claimed that the United States lost more than 95,000 jobs last year as a result of the KORUS FTA, because of revisions in data this is likely unreflective of the actual impact of the agreement. In looking at the merchandise trade only, the EPI estimate itself could be off by nearly 40,000 jobs depending on how future revisions of data turn out. That is a fairly large potential margin of error.
However, EPI’s own method fails to meet the standard they set in their critique of the Washington Post Fact Checker: that important factors on jobs should not be ignored. Looking at the merchandise deficit alone provides an incomplete picture of the agreement’s impact. By leaving out services trade, FDI, and other factors, it is the same as trying to determine if your favorite baseball team is winning by only looking at the offense and ignoring how the pitching staff and defense have performed. Just as any baseball teams’ performance must be judged based on its hitting, pitching, and defense, in Part 2 we’ll take a more holistic look at U.S.-Korea economic relations and the issue of jobs.
Troy Stangarone is the Senior Director for Congressional Affairs and Trade at the Korea Economic Institute of America. The views expressed here are the author’s alone.
Photo from JAXPORT’s photostream on flickr Creative Commons.